Analogue Models Are Strongest When They Test Process, Not Prediction
The most reliable analogue thrust-belt models are not miniature forecasts of a basin. They are controlled process experiments that expose which structural outcomes are mechanically plausible under stated assumptions.
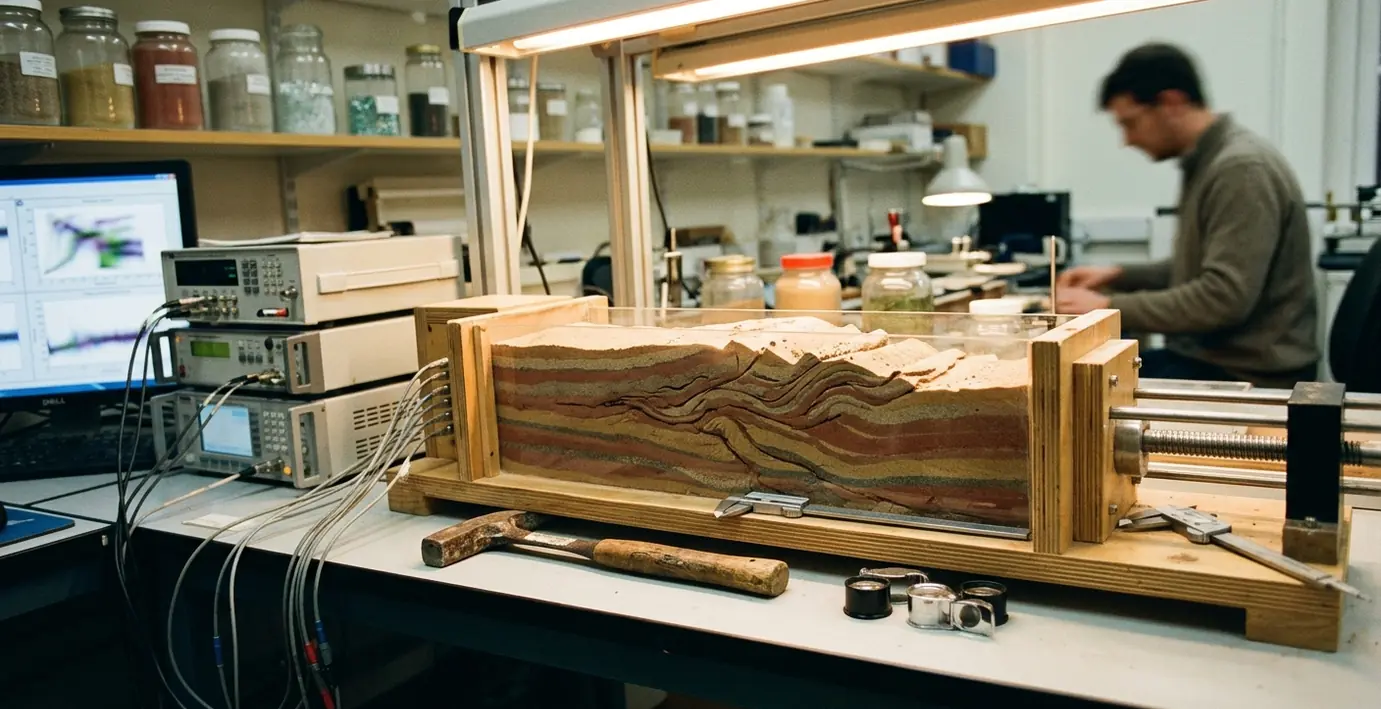
That distinction matters at a conference table. A sandbox model can make a balanced cross-section feel alive: thrusts nucleate, backlimbs rotate, wedges steepen, and the foreland surface responds. But the model does not know the subsurface. It only knows the boundary conditions, the materials, the scaling protocol, and the shortening history imposed on it.
A review of recent conference-style abstracts from 2018 to 2022 pushed this point into sharper focus: predictive language appeared far more often than explicit process testing. I find that risky. Bench-scale analogue modelling works best when the claim stays narrow: this detachment strength permits this deformation pathway; this buttress geometry can trigger this vergence; this sediment loading history delays or localizes thrust activity.
This article stays within bench-scale analogue modelling for thrust belts, fold-and-thrust wedges, foreland basin loading, inversion, detachment-controlled deformation, and basin-margin shortening. It does not cover seismic calibration workflows or reservoir-scale structural mapping.
Bottom Line: Use analogue models to compare deformation pathways, not to draw a deterministic map of buried structure.
What the method can support
- Testing whether a structural style is mechanically plausible.
- Comparing wedge growth under different detachment strengths or basal slopes.
- Evaluating how inherited normal faults or basement steps affect thrust sequence.
- Documenting timing, spacing, vergence, uplift, and subsidence patterns under controlled assumptions.
What it cannot support is more important: a sandbox run should not be presented as a certified image of the subsurface. The field section, seismic interpretation, well control, and basin history still do the geological heavy lifting.
Start With a Single Mechanical Question
The first modelling decision is not sand, silicone, box size, or camera position. The first decision is the mechanical question.
A useful thrust-belt model asks one thing with enough discipline that the answer can be read from the run. Is wedge propagation controlled by a weak basal detachment? Does basement involvement force uplift above a buttress? Does syntectonic sedimentation suppress frontal thrusting? Does inversion reactivate an inherited normal fault before a new foreland thrust forms?
In one detachment-depth planning case, the cross-section review left two viable mechanical hypotheses. One option placed shortening above a shallow weak horizon; the other allowed deeper coupling to the basement. The run matrix stayed manageable only because the observables were limited to thrust spacing and vergence. Target observations were then recorded at roughly 5 cm displacement steps, and the minimum input stratigraphy came from a column about 2.4 km thick.
Turn uncertainty into a hypothesis
A basin-analysis uncertainty usually starts too broad: “What controls the trap geometry?” That question belongs in the interpretation meeting, not on the model bench. The analogue version needs tighter wording.
- Broad uncertainty: Why does the thrust belt change style toward the basin margin?
- Mechanical hypothesis: A weak basal detachment promotes forward-breaking thrusts until a basement step redirects shortening out of sequence.
- Target observables: thrust spacing, vergence, uplift pattern, wedge taper, basin subsidence trend, fault timing, and structural inheritance.
The hypothesis should fit on the setup card. If it needs a paragraph to explain, the experiment is probably carrying too much geology at once.
Build the Scaling Protocol Before the Sandbox
Scaling is not a decoration added after the model works. It is the reason the run can be interpreted at all.
Hubbert-style scale modelling remains the methodological foundation because it forces the modeller to ask which forces must remain similar between the natural system and the bench system. The goal is not numerical mimicry. The goal is dimensionless similarity: the relevant force balance must be preserved for the process being tested.
Four scaling checks
- Geometric scaling: the length ratio between the model and the natural system, including layer thickness, fault spacing, relief, and basin width.
- Kinematic scaling: the imposed displacement path, shortening direction, displacement rate, and total shortening.
- Dynamic scaling: the balance among gravity, cohesion, density contrast, friction, and viscosity where ductile layers are used.
- Temporal scaling: the relationship between model strain rate and geological deformation rate, stated as a modelling assumption rather than a literal clock.
One working protocol fixed the length ratio near 1:50 000 after sand cohesion values matched the 50 to 150 Pa range expected for the analogue material. Strain rate was then held between 10^-4 and 10^-3 s^-1, with total shortening between 25 and 30 cm. Those numbers mattered because they constrained the experiment before the first layer entered the box.
Important: A scale ratio alone does not validate a model. Length, density contrast, gravitational acceleration, cohesion, friction angle, viscosity, strain rate, and total shortening have to be considered together.
Hubbert gives the logic. Davis and co-authors give an important wedge-taper precedent. Graveleau-style apparatus reviews help with practical bench design. Those references do not make a sandbox a field analogue; they only define the mechanical language needed to judge one.
Select Materials by Mechanical Behaviour, Not Convenience
Sand is not sandstone. Silicone is not shale. Glass beads are not a formation.
Analogue materials stand in for mechanical behaviour, not lithological identity. Dry quartz sand commonly represents brittle upper-crustal deformation because it behaves as a frictional granular material. Glass beads can represent lower-cohesion granular layers. Silicone putty can represent a viscous detachment or ductile substrate. Microbeads or corundum powder can define weak horizons. Layered mixtures can create stratigraphic contrasts where friction, density, or cohesion changes through the section.
In a material-selection pass for a thrust-wedge experiment, quartz sand was chosen over glass beads after friction angle tests gave 31 to 34 degrees for the sand and 22 to 25 degrees for the beads. The choice followed the mechanical question: the model needed a stronger brittle package over a controlled basal weakness. The layer preparation then became part of the protocol, with 2 mm sieve drops from about 30 cm height. Grain size was held at 200 to 400 micrometres, and density after compaction was around 1.55 g cm^-3.
Document these properties before each run
- Grain size range.
- Bulk density after preparation.
- Internal friction angle.
- Cohesion proxy or measured cohesion range.
- Moisture condition.
- Layer thickness.
- Compaction and sieving procedure.
Material convenience is tempting because the bench setup already demands patience. Resist it. A poorly documented weak layer can explain almost any result after the fact, which means it explains nothing.
Control the Box, the Boundaries, and the Initial Geometry
The apparatus is part of the experiment. Treat it that way.
A typical thrust-belt analogue box uses rigid sidewalls or low-friction glass walls, a moving backstop or basal conveyor, a fixed foreland wall, a basal detachment sheet, removable spacers, and a camera or laser system. Lighting also belongs in the setup, because poor image capture converts a clean run into an interpretive argument.
Boundary conditions can determine thrust vergence and sequence. A moving wall does not impose deformation in the same way as a basal velocity discontinuity. A fixed buttress can localize uplift. A low-friction basal sheet can distribute shortening farther into the foreland. These are not technical details; they are hypotheses expressed in hardware.
In one apparatus comparison, a moving backstop was selected over a basal conveyor after pilot runs produced vergence reversal in two of three trials. Sidewall friction was reduced with graphite powder. The model width was about 40 cm, and the initial taper was near 1.8 degrees.
Initial geometry decisions
- Model width-to-height ratio.
- Initial taper and basal slope.
- Pre-existing basement step.
- Salt-detachment zone or weak basal horizon.
- Inherited normal fault.
- Synrift basin fill.
- Foreland wall position and backstop geometry.
Davis et al. reported taper angles in the 1 to 3 degree range for critical-taper wedge mechanics. That range does not prescribe a sandbox design, but it keeps the modeller honest when the initial wedge geometry starts to drift away from the process being tested.
Run the Experiment as a Documented Sequence
A good run starts before shortening begins.
- Clean the box and check that the sidewalls are dry, smooth, and prepared as specified.
- Install the basal layer, detachment sheet, or silicone horizon.
- Mark a reference grid visible in plan view and side view.
- Build the stratigraphy using the documented sieve height, layer thickness, and compaction procedure.
- Photograph the initial state with scale markers in place.
- Start shortening at the selected displacement rate.
- Pause at fixed displacement increments.
- Record observations before interpreting them.
- Add syntectonic sediment if the hypothesis requires it.
- Preserve the final section for slicing or photography.
The photography interval deserves attention. In one run series, 5 cm displacement steps missed first fault nucleation in four runs. The interval was tightened to every 3 cm, and setup labels were printed before each build so the image archive could be read without guessing. Displacement was logged to about 0.5 mm precision. Where syntectonic sedimentation was included, sediment was added in roughly 1.2 mm increments.
Log at each increment
- Cumulative shortening.
- Displacement rate.
- First fault appearance.
- Active thrust location.
- Backlimb rotation.
- Wedge height.
- Surface slope.
- Foreland basin subsidence.
- Sediment addition, if used.
Field Note: Fixed camera positions are worth the inconvenience. Plan-view and side-view photographs with consistent lighting often save the interpretation when the final section looks simpler than the run history.
Capture Deformation Before You Interpret It
Observation comes first: what moved, when it moved, and where it moved. Interpretation comes later.
This separation sounds basic until the first clean thrust appears. Then the temptation is immediate: name the structure, tie it to a regional fault, and move on. Slow down. Record the geometry before assigning geological meaning. A thrust that looks like a frontal ramp in the final section may have started as an internal shear zone, linked to a backthrust, or abandoned activity after a short displacement window.
Useful measurement tools include calibrated photography, particle tracking where available, laser surface scans, digital elevation models, grid markers, serial slicing, and final cross-section photography. In one measurement protocol, the laser scan used roughly 0.2 mm vertical resolution. Fault dips were measured to the nearest degree, and section spacing was about 2 cm.
Final sectioning discipline
Stabilize or impregnate the model if the material package requires it. Cut perpendicular to shortening. Photograph every slice with scale, orientation, and run identification visible. Do not let one attractive central section become the entire result.
Serial slicing was selected over a single central cut after earlier tests showed edge effects altering spacing by as much as 18 mm. That does not mean every model needs dense slicing. It means the sectioning plan must match the claim. If the claim concerns lateral continuity, one slice is weak evidence.
Interpret Results Through Controlled Comparisons
A single analogue run is a demonstration. A small run matrix is an experiment.
The cleanest comparison changes one variable at a time: detachment strength, basal slope, shortening rate, inherited fault geometry, syntectonic sediment supply, or backstop velocity. If the matrix changes all of them, interpretation becomes a story about preference rather than mechanics.
In a sensitivity matrix, the base case was repeated three times after the first set showed sequence variation in two runs. The comparison was then limited to two variables per matrix to avoid a combinatorial sprawl. Wedge taper was recorded at about 0.3 degree intervals, and out-of-sequence timing was tracked within roughly 4 cm shortening windows.
Quality-control checks
- Repeat the base case before trusting a sensitivity result.
- Inspect whether the fault sequence is reproducible.
- Compare central and edge sections.
- Confirm final layer thicknesses against the setup record.
- Review whether the imposed boundary condition still matches the original hypothesis.
- State excluded physics plainly; for example, these bench models exclude thermal effects.
The interpretation should return to the original question. If the hypothesis concerned weak-detachment control on forward-breaking thrusts, do not overextend the result into hydrocarbon migration timing, trap seal, or basin-scale thermal maturity without additional evidence.
Worked Case: Detachment-Controlled Foreland Thrust Belt
Use this case as a template for a defensible two-run comparison.
Question
Does inserting a thin weak layer above the basal detachment promote farther frontal thrust advance in a foreland-directed thrust belt?
Baseline run
- Build the brittle package with dry quartz sand using the documented 200 to 400 micrometre grain size.
- Prepare layers with 2 mm sieve drops from 30 cm height.
- Set the model width to 40 cm and the initial taper to 1.8 degrees.
- Shorten the model at the selected rate and photograph every 3 cm of displacement.
- Measure frontal advance only across the central 30 cm of the model to reduce sidewall drag effects.
Run A establishes the baseline. In the reference comparison, the frontal thrust advanced 11 cm.
Weak-layer run
- Repeat the baseline geometry and preparation steps without changing the box, taper, camera position, or displacement logging.
- Insert a 3 mm glass-bead layer at the selected weak horizon.
- Run the same shortening sequence.
- Record thrust spacing, vergence, first fault timing, and frontal advance at the same displacement increments.
- Compare only the central 30 cm measurement window against Run A.
Run B produced a frontal thrust at 19 cm, compared with 11 cm in Run A. The copyable interpretation is narrow and useful: in this geometry, adding a 3 mm weak layer allowed the frontal thrust system to advance farther into the foreland measurement window. Put that sentence on the results slide, followed by the run card, the displacement log, and the paired central sections.
Citations
- Hubbert, M. K. 1937. Theory of scale models as applied to the study of geologic structures.
- Davis, D., Suppe, J., and Dahlen, F. A. 1983. Mechanics of fold-and-thrust belts and accretionary wedges.
- Graveleau review literature on analogue modelling apparatus and experimental precedents for tectonic sandbox studies.
- SI Brochure 2019, used for unit definitions only.