Which Characterization Method Fits the Reservoir Question?
Are you trying to map a connected pore system, or prove that stimulation can create one?
That single question dictates the entire trajectory of a subsurface evaluation. Conventional and unconventional characterization represent entirely different decision systems, not simply different toolkits. Applying the wrong framework to a play does not just yield suboptimal results; it generates fundamentally flawed economic models.
Conventional reservoirs are defined as accumulations where buoyancy, trap, seal, and natural permeability commonly dominate production behavior. The hydrocarbons have migrated from a source rock and accumulated in a discrete structural or stratigraphic trap. Characterizing these systems requires proving that the container exists, that it holds hydrocarbons, and that the rock can deliver those fluids to a wellbore under natural pressure.
Conventional vs. Unconventional Reservoirs: The Subsurface Problem Is Different
Because the physics of fluid storage and flow differ, the subsurface problem requires a different starting point.
Conventional characterization usually starts with trap geometry, reservoir continuity, fluid contacts, pressure communication, and depositional architecture. The primary objective is defining the boundaries of the container and the distribution of high-quality rock within it. If the trap is breached or the reservoir sands pinch out unexpectedly, the project fails regardless of how much oil is in place.
Unconventional characterization often starts with rock quality, completion quality, organic richness, brittleness, natural fractures, pore throat distribution, and stress anisotropy. The hydrocarbons are typically still residing within or immediately adjacent to the source rock. The container is effectively limitless in the lateral dimension, but the rock itself is the barrier to flow.
Permeability plays a contrasting role in these two systems. In conventional reservoirs, natural permeability may support commercial flow rates without any stimulation. The rock fabric alone dictates deliverability. In unconventional reservoirs, natural matrix permeability is often insufficient without engineered fracture networks. The characterization effort must therefore predict how the rock will break, rather than just how it will flow.
Data Inputs: Logs, Core, Seismic, Pressure, and Production Evidence
Multi-year research compiled by the University of Calgary indicates that data prioritization follows directly from the distinct starting questions for each reservoir type, with conventional inputs selected to address connectivity and contacts while unconventional inputs target rock mechanics and storage capacity.
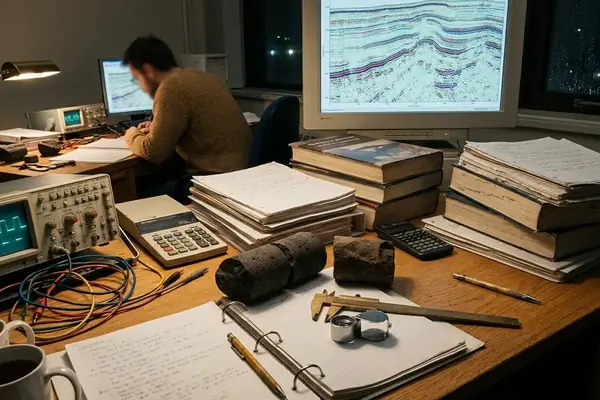
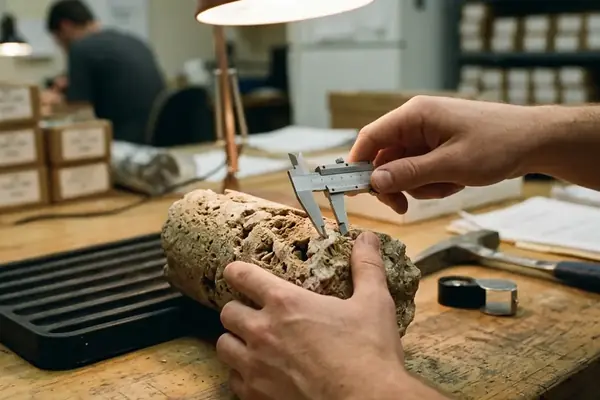
For conventional reservoirs, engineers prioritize wireline logs, core analysis, pressure tests, fluid samples, seismic interpretation, structural mapping, and production tests. Core analysis conducted over intervals of roughly 0.5 to 2 meters in conventional appraisal provides the foundational matrix permeability data required to calibrate these wireline logs. Fluid samples establish the pressure-volume-temperature (PVT) behavior necessary for facility design, while seismic interpretation maps the structural spill points.
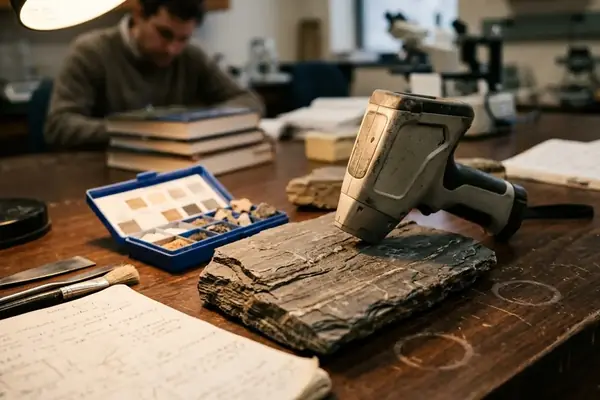
For unconventional reservoirs, geoscientists emphasize core mineralogy, total organic carbon (TOC) and maturity indicators, geomechanical testing, image logs, microseismic or fracture diagnostics where available, stimulated rock volume concepts, and early production response. Standard porosity and permeability measurements take a back seat to geomechanical properties like Young's Modulus and Poisson's Ratio, which dictate how effectively a hydraulic fracture treatment will propagate.
Scale and Resolution: Why Core, Logs, and Seismic Disagree
Scale mismatch remains a central reason reservoir characterization methods diverge. Subsurface professionals constantly battle the resolution gap between what they can see in a microscope and what they can map on a seismic section.
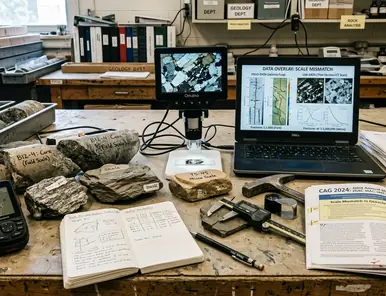
Core plugs and thin sections offer high-resolution but spatially limited evidence of pore geometry and mineralogy. They represent a microscopic fraction of the total reservoir volume. Logs provide continuous wellbore-scale measurements that require rigorous calibration to core and petrophysics. Seismic data covers massive spatial areas but lacks the vertical resolution to identify thin baffles or localized fracture swarms.
Field Note: Workflows collapse when scale mismatches are ignored in upscaling from core to seismic.
While these diagnostic frameworks provide robust baselines, their predictive validity degrades in highly tectonized zones. A common failure point occurs when teams attempt to apply conventional petrophysical cutoffs to unconventional source rocks.
Important: Off-the-shelf models fail to distinguish gamma ray response meanings across reservoir types.
In a conventional sandstone, a high gamma ray reading typically indicates shale, which acts as a barrier to flow. In an unconventional shale play, that same high gamma ray reading often correlates with high TOC, marking the most productive interval in the wellbore.
Bottom Line: Core-to-log calibration holds when mineralogical variation stays below thresholds observed in mixed lithology intervals.
Workflow Design: From Static Description to Development Decision
Historically, asset teams attempted to force unconventional data into conventional modeling software. This approach consistently failed to predict well performance because the underlying assumptions regarding Darcy flow and boundary-dominated behavior did not apply. Today, the industry uses distinct workflows tailored to the specific physics of the reservoir.
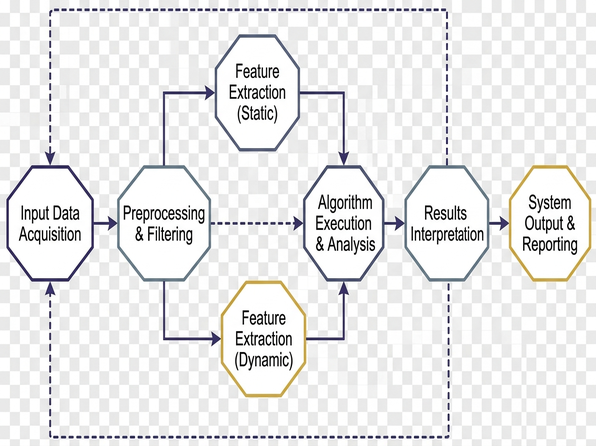
Engineers map the conventional workflow through a sequential process: basin and play context, seismic interpretation, well correlation, petrophysical evaluation, facies modeling, structural framework, saturation model, pressure and fluid integration, and finally, dynamic calibration. This linear progression builds a static container and then fills it with fluids to simulate extraction.
Conversely, teams map the unconventional workflow through an iterative loop: regional stratigraphic screening, source-rock and maturity assessment, landing-zone selection, mineralogical and geomechanical evaluation, fracture-network prediction, completion design feedback, and production type-curve calibration. The static model is never truly finished; it evolves with every new completion design.
Conventional characterization often asks where hydrocarbons are stored and how they move naturally. Unconventional characterization asks which rock can be economically contacted by engineered stimulation.
Uncertainty Changes Shape Across Reservoir Types
Risk does not disappear when moving from a conventional offshore platform to an onshore shale pad; it simply changes shape.
Conventional uncertainty commonly concentrates around trap integrity, net-to-gross, facies continuity, fluid contacts, fault transmissibility, and aquifer support. A single dry hole can condemn an entire fault block. If the seal is compromised, the reservoir is guaranteed to be water-bearing, rendering all other rock properties irrelevant.
Unconventional uncertainty commonly concentrates around producible rock volume, fracture containment, stress barriers, landing-zone consistency, completion interference, and long-term decline behavior. The presence of hydrocarbons is rarely in doubt. The uncertainty lies entirely in the recovery factor and the capital efficiency required to achieve it.
Compare static uncertainty versus dynamic uncertainty—conventional models may be updated by pressure and production history, while unconventional models often require completion and production feedback loops. A conventional simulation might take years to show deviation from the base case. An unconventional model can be invalidated during the first week of flowback if the fracture network fails to connect with the matrix as predicted.
A Practical Selection Framework for Study Design
Selecting the right characterization method requires working backward from the business objective. Deploying every available diagnostic tool is neither cost-effective nor scientifically rigorous.
Step 1: identify the decision. Are you conducting exploration risking, appraisal, field development planning, refracturing, infill drilling, reserves classification, or reservoir management? Each of these decisions requires a different level of confidence and a different spatial scale of data. For formal reserves booking, teams must align their characterization methods with the Petroleum Resources Management System.
Step 2: identify the controlling uncertainty. Pinpoint the specific variable that will make or break the project economics. Is it geometry, facies, saturation, pressure connectivity, permeability, organic richness, brittleness, stress, or completion response? Once the controlling uncertainty is isolated, the study design practically writes itself.
Worked Comparison: Sandstone Appraisal Well vs. Shale Landing-Zone Study
To illustrate how these frameworks dictate field operations, consider two distinct appraisal scenarios.
For a shale landing-zone study, the asset team outlines a package using continuous core description, mineralogy, organic indicators, image logs, rock mechanics, stress interpretation, and completion-response feedback. The goal is to identify a roughly 10-meter window that possesses both the organic richness to store hydrocarbons and the brittleness to shatter effectively during hydraulic fracturing. The team runs dipole sonic logs to calculate dynamic rock properties and uses microseismic monitoring on the offset pad to verify that the induced fractures stay contained within the target horizon.
For a conventional sandstone appraisal well, the team outlines a characterization package using core porosity and permeability, wireline logs, pressure gradients, fluid sampling, seismic mapping, and depositional facies correlation. The objective is to confirm the structural spill point and verify that the reservoir sands correlate across the fault block. The team runs formation testers to establish fluid gradients and identify the exact depth of the oil-water contact. The dynamic validation of this conventional sandstone model depends entirely on pressure data collected during build-up tests that typically run 48 to 72 hours.