Start With the Measurements That Control the Play Call
Rock-Eval pyrolysis converts a crushed shale sample into S1, S2, S3, Tmax, and derivative indices that can materially change a shale or tight-resource assessment. The objective is not to label a rock as simply “good” or “poor”—instead, the methodology builds a repeatable evidence chain from sample selection through organic richness, kerogen quality, maturity, contamination control, and uncertainty ranking.
In shale and tight resource plays, source quality, retained hydrocarbons, mineral fabric, pressure history, and producibility must be interpreted together. Automated summaries often collapse laminated versus silty beds into single values despite the strict requirement for discrete sampling. How do we ensure the laboratory data reflects the reservoir rather than a sampling artifact?
Design the Sampling Program Before Any Instrument Run
Historical sampling programs frequently obscured critical heterogeneity by averaging distinct lithologies. To close this gap, modern protocols demand discrete sampling resolution. Every sample must be tied to a measured depth with 0.1 m precision and correlated directly with the mudlog.
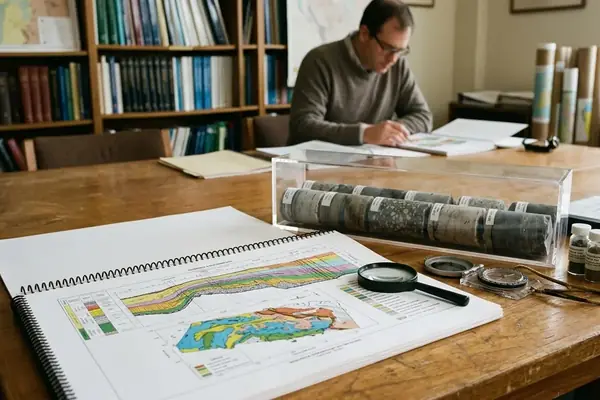
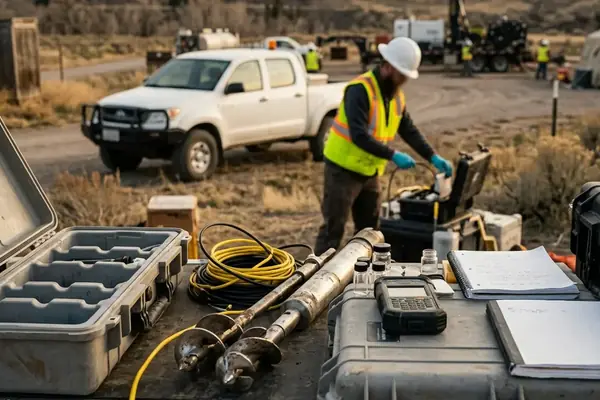
Slabbed core, core plug trims, sidewall core, unwashed cuttings, washed cuttings, outcrop samples, and legacy archived material each carry different biases. A sidewall core provides precise depth control but risks drilling fluid invasion. Unwashed cuttings offer continuous coverage but suffer from mixing and caving.
Important: Control contamination risks from oil-based mud, pipe dope, drilling additives, migrated staining, handling oils, and weathering. Flag these samples in the database rather than silently excluding them.
Storage conditions dictate sample viability. They must be logged at -20 C within about 48 hours of retrieval to halt microbial degradation and volatile loss. Shallow analyses routinely omit this cold storage logging, leading to compromised baseline data.
Prepare Samples So the Laboratory Measures Rock, Not Handling History
The working hypothesis dictates that sample preparation introduces more variance than instrument error. The methodology begins with visual inspection and the physical removal of obvious contaminants. Drying is limited to roughly 60 C for 4-6 hours before crushing to 60 mesh. This thermal ceiling prevents the artificial loss of light hydrocarbons.
Following crushing, the material undergoes splitting and homogenization. An archive split is retained at a minimum of about 5 g per interval.
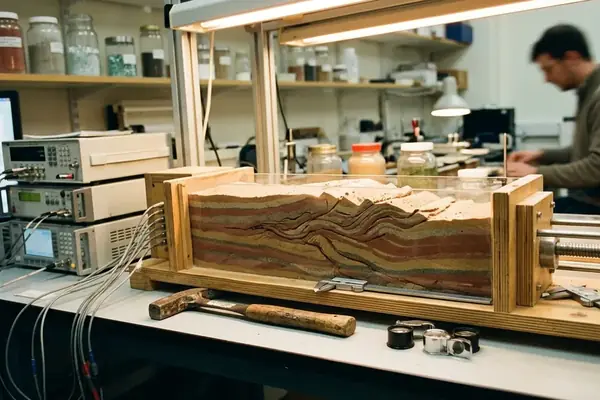
Variables require strict control. Drying temperature, exposure time, grain-size targets, crushing equipment cleanliness, split mass consistency, and whether the sample was powdered before or after carbonate treatment all influence the final measurement. One preparation method does not serve every test equally. Separate preparation pathways must be established for TOC, pyrolysis, vitrinite reflectance, XRD, microscopy, and solvent extraction.
Screen Organic Richness With TOC and Carbon Speciation
Total Organic Carbon (TOC) serves as the first quantitative gate because it measures organic carbon content after accounting for inorganic carbon where the method requires it. Common tool pathways include dedicated combustion analyzers and acid treatment protocols for carbonate-rich rocks. The workflow must distinguish total carbon from inorganic carbon to apply the correct correction factors. Hydrochloric acid digestion removes the inorganic fraction, leaving only the organic material for combustion.
Matrix effects in carbonate-rich, pyritic, clay-rich, or thermally mature intervals complicate the interpretation. TOC alone does not define generative capacity. A rock composed entirely of inertinite will not yield hydrocarbons regardless of its total carbon volume. Does the measured carbon represent generative kerogen, or is it a byproduct of recycled organic matter? Establishing an optimal baseline requires pairing TOC with speciation data.
Run Programmed Pyrolysis as a Controlled Thermal Experiment
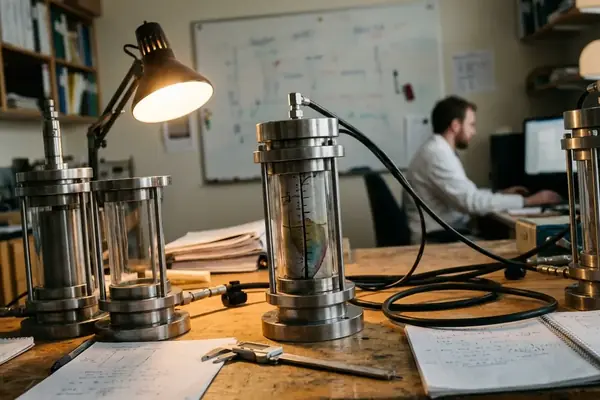
Programmed pyrolysis operates on the premise that controlled heating mimics natural maturation. Rock-Eval-type or equivalent source-rock analyzers heat crushed rock under controlled conditions, recording free hydrocarbons, generated hydrocarbons, carbon dioxide, and temperature-linked responses.
The core outputs define the resource potential. S1 represents thermally released free hydrocarbons volatilized at lower temperatures. S2 quantifies hydrocarbons generated from cracking the remaining kerogen as the oven temperature ramps up. S3 measures the carbon dioxide yield, providing insight into the oxygen content of the kerogen. Tmax indicates the temperature at maximum S2 release, while derived indices such as hydrogen index and oxygen index characterize kerogen type.
To make the protocol replicable, specify the instrument model, sample preparation state, carrier gas, calibration checks, detector configuration, and cleaning cycles. Sample mass is held between 50-100 mg depending on expected TOC. Tmax is recorded only when S2 exceeds about 0.2 mg HC/g rock. Below this threshold, the S2 peak becomes too broad and poorly defined to assign a reliable temperature maximum.
Field Note: Interpretation requires calibration to local lithofacies. A universal cutoff value rarely applies across different depositional environments.
Cross-Check Thermal Maturity Instead of Trusting One Proxy
Legacy assessments often relied solely on Tmax to define the thermal maturity window. This approach leaves a significant gap, as Tmax can mislead in low-S2 samples, migrated-oil intervals, carbonate-rich rocks, clay-catalyzed systems, or very high-maturity gas-window samples. The proposed approach builds maturity interpretation from multiple lines of evidence.
Integrate Tmax behavior, vitrinite reflectance, solid bitumen reflectance where appropriate, biomarker maturity ratios, production fluid character, and burial-temperature modeling. Place ISO-style vitrinite reflectance practice in context. Petrographic reflectance methods provide a maturity anchor—though shale and marine source rocks may lack suitable vitrinite or may require solid-bitumen equivalents to establish a reliable thermal baseline.
Tie Organic Matter to Lithofacies, Mineralogy, and Texture
Source-rock evaluation for unconventional plays must link generative quality with rock fabric and storage behavior. Mineralogical tools provide the necessary context. X-ray diffraction (XRD) quantifies bulk mineral composition, carbonate and clay proportions, and brittle-ductile tendencies. Scanning electron microscopy (SEM) and petrography map organic-matter distribution, lamination, and pore context.

Microscopy distinguishes amorphous organic matter, inertinite, vitrinite, solid bitumen, algal material, and recycled organic particles where visible. Integrating these datasets prevents the mischaracterization of storage capacity. How do these microscopic textures scale up to influence macroscopic fracture propagation and fluid flow?
Use Extracts and Fluids to Separate Indigenous Charge From Contamination
The underlying hypothesis is that fluid chemistry can isolate indigenous hydrocarbons from introduced artifacts. Solvent extraction, Saturates, Aromatics, Resins, and Asphaltenes (SARA) fractionation, gas chromatography (GC), and GC-MS belong in the workflow when addressing suspected migrated oil, anomalous S1 responses, oil-based mud exposure, condensate-rich intervals, or charge-history questions.
Extractable organic matter helps distinguish indigenous bitumen, migrated hydrocarbons, drilling additives, and biodegraded or evaporatively altered material. The methodology demands rigorous control over solvents, glassware cleanliness, blank runs, sample storage, and extraction timing. Trace contamination can easily dominate a small sample, skewing the entire geochemical profile.
Bottom Line: This sequence isolates the true reservoir signal from the noise of the drilling and handling process.
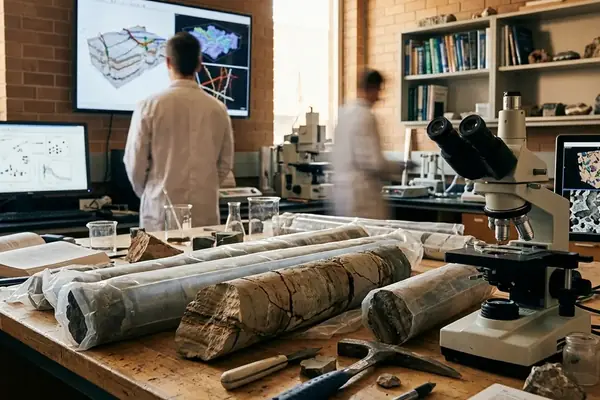
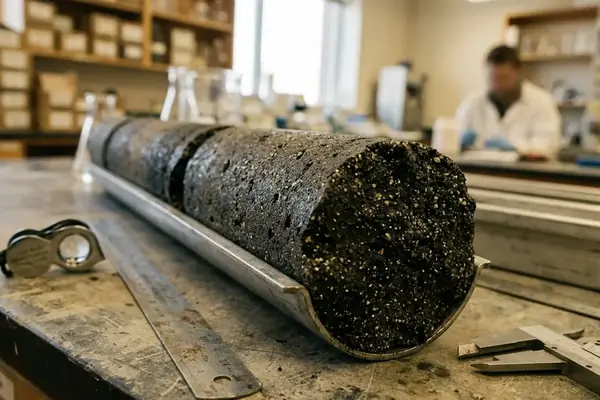
In the core viewing room, a junior geologist aligns a slabbed section of the Montney Formation under the fluorescent lamp. She cross-references the 0.1 m depth markers against the mudlog, flagging a thin, silty lamination that previous bulk sampling had entirely missed. With a scalpel, she carefully isolates a small split, seals it in a pre-cleaned vial, and logs the transfer to the -20 C freezer. The laboratory will now measure the rock exactly as the reservoir preserved it.