Quick Nav
- The reservoir decision risk tied to wavelet phase and shallow imaging.
- The Athabasca McMurray case frame and near-surface setting.
- Why conventional assumptions can misread shallow heavy-oil seismic.
- A diagnostic workflow for separating geology from processing artefact.
- An integrated interpretation rebuild using ties, statics, and rock physics.
- What better decision confidence looks like in reservoir discussions.
- Citations for domain context and seismic property framing.
- The next gate to run before final picks enter the model.
The Stakes: A Reservoir Decision Can Move with the Wavelet
Start with the decision, not the display
Poor seismic imaging in the Athabasca oil sands can move more than a coloured horizon. It can misplace channel edges, weaken caprock confidence, distort steam chamber planning assumptions, and nudge well-pair placement toward the wrong side of a geological boundary.
In the field review reconstructed here, channel edge placement began by cross-checking wavelet phase stability against known McMurray depth markers before any horizon interpretation. That order matters. A clean-looking event with unstable phase still makes a poor reservoir marker.
The review window was short: roughly 3-5 days after the first migrated volume arrived. That is common in development work, where interpreters need to decide whether a volume can support model updates or whether processing questions still sit in the critical path.
Important: Treat the first migrated volume as evidence for a quality-control meeting, not as a picking surface. In shallow McMurray work, the wrong wavelet can make a channel edge look more certain than it is.
This article uses a case-study-style reconstruction of a recurring Athabasca imaging problem: shallow McMurray reservoir targets, low structural relief, variable near-surface conditions, and difficult seismic-to-well calibration. The practical audience is specific: geophysicists, development geologists, reservoir engineers, and interpreters who use seismic as a decision-support tool rather than as a standalone truth source.
Case Frame: A Shallow McMurray Target in a Noisy Near Surface
Public context, not a private lease story
The case setting stays deliberately non-proprietary. It reflects Athabasca oil sands patterns described in public regulator and journal sources: shallow bitumen-bearing McMurray Formation intervals, muskeg and glacial overburden, and subtle stratigraphic targets that rarely announce themselves with dramatic structural relief.
The scope is limited to recurring shallow McMurray patterns documented in public Alberta Energy Regulator material rather than any single operator lease or survey. The Alberta Energy Regulator ST98 oil sands reserves and outlook, 2024 edition, provides domain context only. It explains why Athabasca oil sands remain a high-value technical domain, but this workflow does not quote reserve or production figures from it.
What the seismic needed to support
The imaging objective was not to make a prettier seismic panel. It was to improve confidence in reservoir continuity, channel architecture, and non-reservoir baffles that affect steam-assisted gravity drainage planning and geological model updates.
Near-surface thickness sat in the 80-140 m range in the reconstructed review context. That overburden interval may look modest compared with deeper conventional plays, but it can dominate the time solution when the target is shallow and the reservoir relief is subtle.
A University of Calgary classroom discussion and a Calgary asset-room review would likely ask the same first question: which seismic features survive calibration, and which features only survive display scaling?
Challenge: Why Conventional Imaging Assumptions Failed
Data first, interpretation second
The warning sign came from timing, not from the horizon map. First-break residuals exceeded about 4 ms on multiple lines, and raw gathers carried timing errors in the 3-7 ms range. In shallow oil sands imaging, that is enough to shift apparent channel margins.
Overburden statics errors exceeding roughly 4 ms produced false channel edges in multiple Athabasca surveys. That sentence should make an interpreter slow down. A small time shift can flatten true stratigraphic variation or create a margin where the reservoir architecture does not require one.
Why amplitude alone could not settle it
The reservoir elements carried weak vertical relief, thin or laterally variable sands, and low impedance contrast in places. The rock-physics picture added more ambiguity: bitumen saturation, temperature sensitivity, shale content, water-bearing sands, and gas effects can all alter seismic response.
The Leading Edge papers on SAGD time-lapse monitoring and heavy-oil seismic properties frame the same caution from different angles. Heavy-oil seismic response is useful, but it is not uniquely interpretable from amplitude alone. Those papers do not validate this reconstruction survey by survey; they frame the physical risks that a shallow Athabasca interpretation must manage.
The open question at this stage was narrow: did the suspicious lineaments track geology, or did they track the acquisition and statics solution?
Diagnostic Workflow: Separate Geology from Processing Artefact
The QC sequence before picking
The diagnostic workflow started before interpretation. That is the point. If static corrections, phase, or residual moveout remain unstable, a geologically attractive channel edge may simply be an imaging artefact.
- Review acquisition footprint and line orientation against mapped lineaments.
- Inspect first-break quality before accepting the weathering solution.
- Audit elevation and weathering corrections for local discontinuities.
- Compare raw gathers, intermediate products, and migrated volumes.
- Test whether suspicious lineaments follow survey geometry.
- Flag features that persist after processing QC for geological testing.
Each mapped lineament was tested against survey geometry before geological interpretation. The QC loop usually took 2-3 iterations per line. That pace is not glamorous, but it prevents a common mistake: interpreting a processing symptom because it happens to resemble a McMurray channel edge.
The decision table
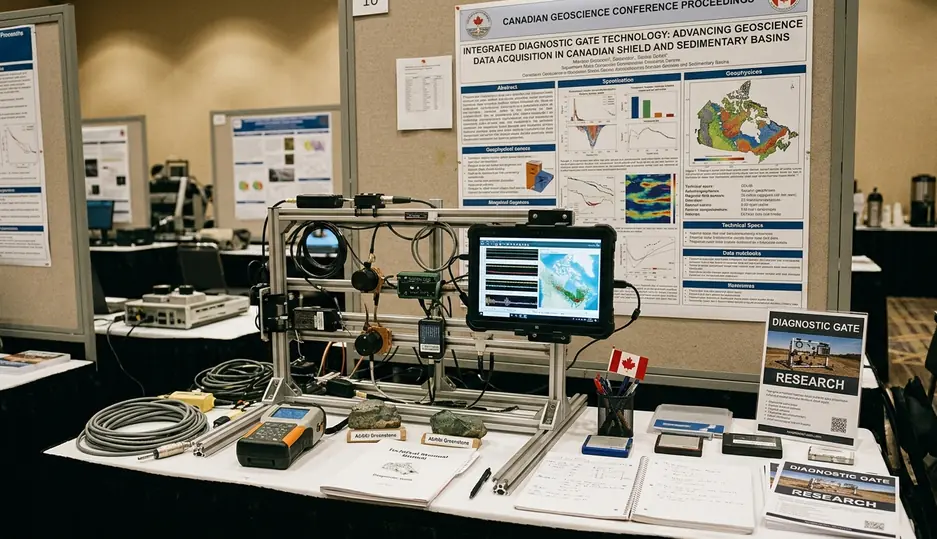
The practical tool was a decision table. Every observed seismic feature had to compete against several possible causes before it could become a reservoir input.
- Reservoir edge: supported by well control, stratigraphic position, and phase-consistent event character.
- Shale plug: plausible where well markers and depositional context supported local baffling.
- Overburden channel: suspected where timing shifts aligned with near-surface complexity.
- Acquisition footprint: likely where lineaments paralleled survey geometry.
- Residual statics: flagged where first-break behaviour and gather alignment remained unstable.
- Tuning: considered where thin-bed expression changed with bandwidth and phase.
- Phase instability: marked where synthetic ties could not hold a consistent event relationship.
Field Note: The fastest way to lose an interpretation meeting is to defend a channel pick before proving it does not follow the survey grid.
Solution: Rebuild the Interpretation Around Ties, Statics, and Rock Physics
An integrated workflow, not a software fix
The solution was not a new button in a processing package. It was an integrated workflow: disciplined statics review, phase-consistent processing, synthetic well ties, rock-physics screening, and interpretation rules agreed before final picking.
Statics re-picking came first. Synthetic tying waited until the statics behaviour could support a stable phase comparison across the 25-45 Hz bandwidth window. Residual statics were reduced to under about 2 ms before final migration.
That order protected the interpretation. Statics review reduced false structure risk. Phase control improved event consistency. Synthetic seismograms linked seismic events to stratigraphy. Rock physics prevented the team from over-reading amplitude anomalies as facies predictions.
Processing choices that changed the conversation
The practical choices stayed conceptual but strict. Residual statics iteration had to be documented. Amplitude-preserving care mattered where inversion or AVO-style reasoning would follow. Bandwidth checks tested whether thin stratigraphic expression survived processing. Noise attenuation had to suppress incoherent energy without erasing subtle McMurray features. Migration QC closed the loop.
Rock-physics screening required local well calibration and failed when bitumen saturation varied rapidly. That failure was useful. It defined where amplitude interpretation could support a ranked geological idea and where it should remain advisory.
Bottom Line: In shallow heavy-oil seismic, the best interpretation rule is often a restraint rule: do not promote an amplitude anomaly into a reservoir property until the tie, phase, statics, and geology all agree.
Results: Better Decision Confidence, Not False Precision
What improved
The strongest outcome was a cleaner separation between seismic features suitable for reservoir-model input and features that required caution flags. That may sound modest. In reservoir planning, it changes the meeting.
Channel-edge interpretations became easier to rank by confidence. Questionable amplitude anomalies did not move directly into facies prediction. Development discussions could distinguish mapped risk from unmapped uncertainty.
Interpretation register entries were created only after both processing QC and geological plausibility checks passed. Well-to-seismic misties were documented in the 4-8 m depth range rather than buried in informal notes.
QC outputs worth keeping
The result was qualitative, but the documentation was measurable. Readers running similar projects should preserve the following checks in their own review files:
- Synthetic tie quality, including event selection and phase assumption.
- Phase consistency between wells and across the mapped area.
- Residual statics behaviour before final migration.
- Frequency content through the target interval.
- Horizon misties at control wells.
- Gather flatness after moveout correction.
- Well-to-seismic event confidence by marker, not by survey as a whole.
This distinction keeps the interpretation honest. A seismic marker can be strong enough for structure control yet too uncertain for direct facies mapping. Another marker may be weak on amplitude but valuable for ranking channel continuity when wells and stratigraphy support it.
Citations
References were selected from publicly available regulator and journal sources only. They support domain context, SAGD monitoring background, and heavy-oil seismic property framing.
- ST98: Alberta Energy Reserves and Supply/Demand Outlook, Alberta Energy Regulator, 2024 edition.
- Time-lapse seismic monitoring of steam-assisted gravity drainage of bitumen in the Athabasca oil sands, Alberta, Canada, The Leading Edge, 1994.
- Heavy oils: seismic properties, The Leading Edge, 2006.
Next Move: Run a Well-Tie Gate Before Committing Picks
Lock the markers before model import
The next step is a formal well-tie gate immediately after final migration delivery. In the reconstructed workflow, the gate decision window was set at 7-10 days, long enough to review the evidence but short enough to protect the reservoir-model schedule.
The gate should combine synthetic seismograms, phase checks, residual statics review, and geological plausibility scoring. It should decide four things: accepted seismic markers, conditional markers, rejected artefact-prone events, and features requiring additional processing or geological review.
Open a short interpretation register before final horizon picking, list each candidate marker, assign its gate status, and record the evidence basis so reservoir-model users know which seismic inputs carry high confidence and which ones are advisory.